Professor Sheila Patek, Heymeyer Professor of Biology and Jacob Harrison, a Ph.D. student in Biology received a Jump Start grant in 2019 from Duke Learning Innovation to improve undergraduate students’ ability to communicate research, using R for data visualization. Below, the instructors describe the experience, and generously provide recommendations and resources for anyone who wishes to train their students to use R for data visualization.
Instructor Reflections
Implementing the R basics and data visualization exercises produced from this grant were transformative for BIO 429S (How Organisms Move) and BIO 329L (Principles of Animal Physiology). Both courses include in-depth data collection and exploration that require students to communicate their research in a clear and effective way.
The goal of this grant was to compile resources on learning R basics and data visualization in order to help students effectively communicate their science. Prior to the DLI JumpStart grant, students in BIO 429S were expected to learn R from lab exercises and students in BIO 329L were not expected to learn R at all. Though R exercises were already a part of BIO 429S, learning R basics helped students who had never used R before and allowed them to engage with the material much faster and more successfully. These R exercises especially benefited the students in 329L. This course had never before used R to supplement the data exploration and visualization. By integrating R into the course, students showed considerable improvement on their fundamental understanding and visualization of data.
Future implementation of these exercises should be gradual and paired with practical exercises. In the 329L course, we used a portion of our lab time each week to practice R. Over time, students became more comfortable using R and by the end of the course every student was able to use R to visualize their data. I would also recommend weekly office hours devoted to helping students become more comfortable in R.
Student feedback on the R exercises
I think the part of the labs that provided me the most challenge was the coding itself. I don’t have a super strong background in coding, and I would be tripped up a good bit when I thought of something I would like to do but was just unable to put it into code or find a source to put it into code. With that being said, I think I did gain a good bit of r coding skills throughout the labs especially when it came to graphs.
Student in BIO 439S – Fall Semester 2019
I am most proud of the graphs I produced because they were a result of both improved writing, understanding, and coding. By the end, I was determined to make any graph I wanted a reality, despite the more difficult coding required. This in turn enabled me to do some great analysis in my submissions.
Student in BIO 439S – Fall Semester 2019
I am most proud of the improvements I made in my coding skills, my figure legend writing ability, and my ability to create the actual graphics. … I am truly proud of the growth that it shows in these skills. I can make better, more aesthetic graphs in R, I can code much better and faster now than when I started, and the way I can now interpret data is much more rigorous than when I first began the course.
Student in BIO 439S – Fall Semester 2019
This class is challenging but you will leave with a deep understanding of material and know how to write a scientific report. I really enjoyed the lab portion of the course since I learned a lot about handling model organisms, conducting scientific inquiry, and critically analyzing results to inform future studies.
Student in BIOL 329L – Spring Semester 2020
I’m really glad that I decided to take this class! After taking so many chemistry and physics class it is nice to finally see all of the pieces come together and be applied in a really interesting way. Also, I feel like the class taught me about basic research and how cool it is and I’m thankful for that!
Student in BIOL 329L – Spring Semester 2020
Compare student work before and after R

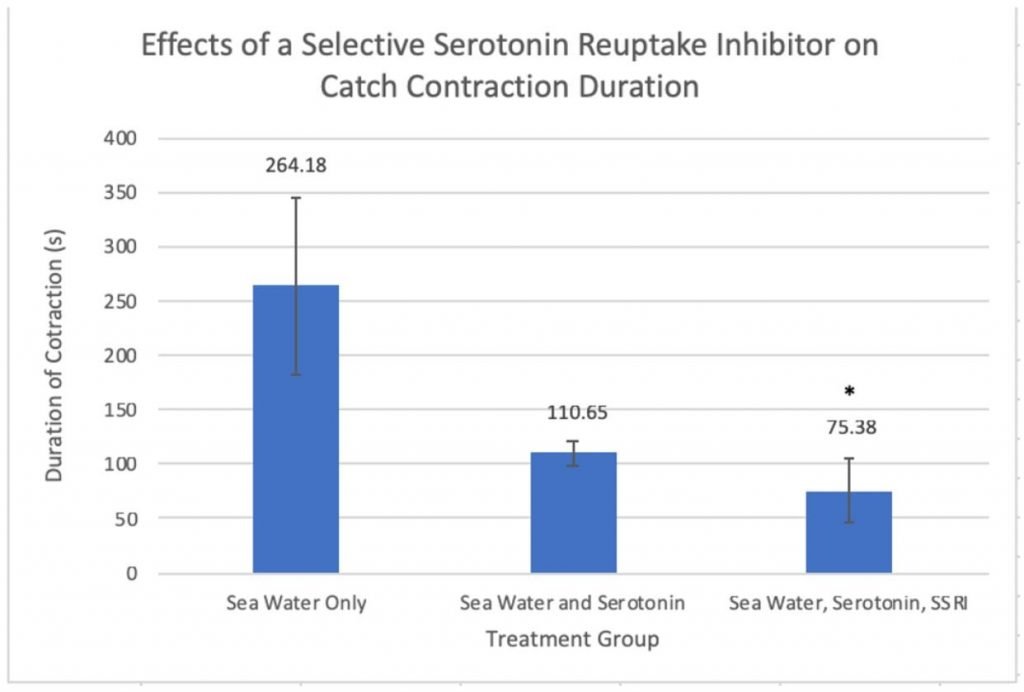
Before we implemented the R graphing exercises, the figures students produced for their final paper would look much like the figures shown above. Without R, most students relied on excel to produce their graphs. Excel figure making and data exploration is incredibly limited and, in some cases, prone to error. For example, the error bars in the left graph shown above do not make sense with the data. One of the main issues with excel is that students can click random buttons to produce error bars or regression lines without understanding their meaning or knowing whether they are actually correct.


By implementing R early in the course and guiding students through the basics of data exploration and visualization the end result is much improved. Above are two examples of submissions from 329L taught in Spring 2020. These figures are easier to read and are more engaging. Overall, students who had short but constant exposure to R exercises showed a much stronger ability to explore and visualize their data and this resulted in a deeper connection and understanding of their research.
Instructor Tips
Student engagement in the R portion of the class was not well received at first, but it improved over time as students got more comfortable with the coding and were able to see the benefits of learning how to visualize their data. Spending a little time each week devoted to working through small manageable chunks of R helped. We also had a wide range of R experience. Some students were already experts in using R, while others had never even coded before. By asking experienced students to help instruct and help field questions from other students it helped keep everyone on task and engaged in the material.
Resources
- Getting Started with R PDF helps students download R Studio and guides them to a helpful exercise to learn how to navigate R studio
- Data Basics Visualization PDF and mp4 video (by Mine Çetinkaya-Rundel) teaches students how to organize their data and includes some helpful links on graphing basics
- R cheatsheets (PDF) for the R packages ggplot and dplyr to help them remember commands and syntax
- R script files ManipulatingData.R and PracticeRPlotting.R include some data manipulation and visualization techniques using the R packages ‘ggplot’ and ‘dplyr’