This post is co-authored by Kim Manturuk and Andrea Novicki
The Data Analysis and Statistical Inference Coursera MOOC is huge! There are over 85,000 students in the class from all over the world. The interactive map below shows the locations of students who completed out pre-course survey. If the survey is representative (and students in this class know why that matters!), then each student on this map represents 5 students in the course.
Over 50,000 students have accessed the course website, over 36,000 have watched at least one video, and over 22,000 students are still active during the third week of the course. This course also has the highest number of Signature Track sign-ups of any Duke Coursera course to-date.
Why are students taking the course? The majority of people are participating in the course because it teaches useful skills. As shown in the chart below (click to enlarge), an overwhelming majority of students felt that an important reason for them to enroll in the class was to learn something they will use in their career.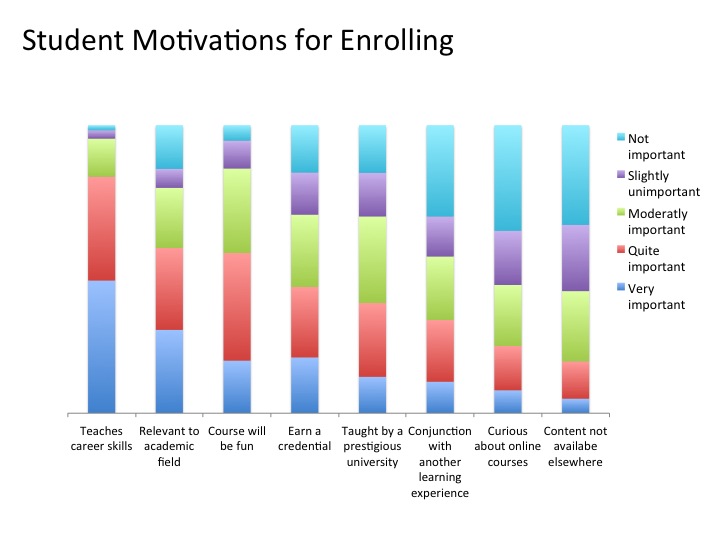
The second most common reason for enrolling is related – students expect to learn a skill relevant to their academic field. In addition, a majority of students expected the course to be enjoyable, and a much-higher-than-typical percent of students felt that earning a credential was important to them.
This unique combination of practical skills and an enjoyable learning experience is reflected in the posts students made in the Discussion Forum thread asking why they are taking Data Analysis and Statistical Inference:
I am a Marketing Director and moving my organization towards data driven marketing, and looking forward to building my expertise in statistics and data analytics.
I work as Business and Process Analyst for a large multinational company.
I have joined Coursera in order to enhance my statistical and analytical skills.I am taking this course because I am an analyst for a think tank in the DC area and want to improve my analysis skills.
In addition to statistics, I need to do different kind of data analysis in my research for which I chose R as a primary platform. Up till now I’ve taught R to myself and feel the need to get a basic training. I hope this course would suit my training needs and also serve as the foundation in this specialization.
While I don’t use modeling and stats in my daily activities, I have 3 Analysts and 2 Strategy Managers reporting into me who do. I would like to have a better understanding of the work they do every day.
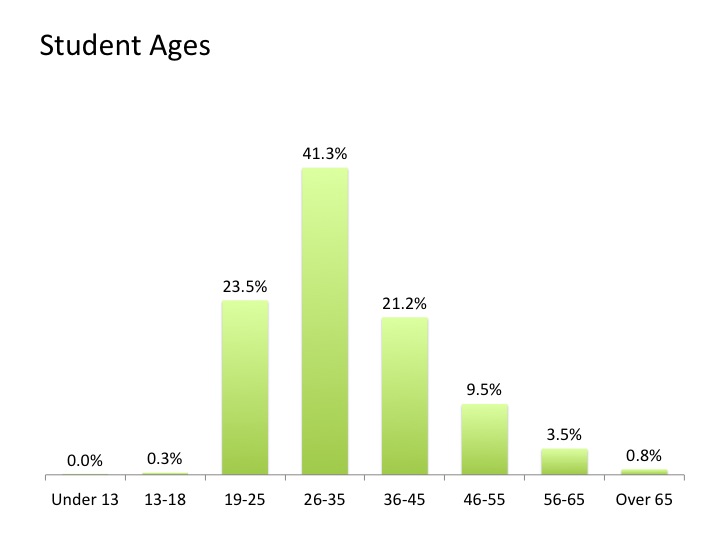
The course has enrolled a wider age range of students than many of the MOOCs typically attract. While you can see below that the majority of students are under 35, there is a big group of students in the 36-45 age range and 9.5% between 46-55. Most MOOCs have a much higher concentration in the under 35 age group.
Course Design
This course has seven units, organized by learning objectives. Students are given clear learning objectives they are expected to be able to do at the end of the unit. Click on the image of Unit 3 learning objectives to access a PDF of all of the objectives for Unit 3.

To achieve these learning objectives, students are provided with many resources. Dr. Çetinkaya-Rundel has created videos explaining the content and giving real-life examples, suggested readings from the free textbook, and suggested additional exercises. In addition, students are given quizzes for each unit that can be attempted three times, with feedback on the student answers that directly references the learning objectives.
 Students have praised the clear explanations in the videos, which come with in-video questions. The clarity of the explanations is echoed in the design of the presentations materials.
I’m about 30 mins into the second week’s lecture, and thus far the explanations of these concepts is far and away the best I’ve ever seen! Thank you Professor! I’m thoroughly enjoying this class and I’m learning a TON!
I have taken a course before on Coursera and one on EdX as well as “browsing” other courses on both platforms. This is by far the best. The syllabus is clear, concise and takes a logical path from basics to the more complex. The video lectures are also of a high quality and Dr Cetinkaya-Rundel explains things in a very easy to follow, conversational manner…
Absolutely fantastic.This is my 6th Coursera class, and I’ve probably seen more than a dozen explanations of Bayes’ rule. After lecture 2 in this class, I feel like I finally understand it. I could go on for hours with examples like that… and it’s only the second week.
Simply amazing!This course answered some many questions I had such a hard time getting right before.
The material could sound classic at first glance, but in fact it’s presented and ordered in such a brilliant way that is surpasses all the previous material on introductory statistics I’ve seen before. Really amazing work !
Dr. Çetinkaya-Rundel co-authored OpenIntro Statistics, a free online comprehensive text that students are encouraged to download. Assigned readings and practice problems from this text help the students master the content. Some students have commented that they find the text very helpful while others prefer the videos; this course is designed to help multiple types of learners succeed. Students have commented:
The fact that they have a free OpenIntro Statistics pdf text book to accompany the course, which I haven’t seen on other courses anywhere and which is also available in paperback for a incredibly modest price on Amazon, is a massive bonus.
The open source textbook is just another cherry on top. I mean seriously, even the latex files are provided.
I agree. I would be lost without the textbook. It’s informative, clearly written, well-edited, and closely follows the lectures. Amazingly, I enjoy reading it too. Thank you, Dr. Çetinkaya-Rundel, for providing a free textbook to accompany the course.
Students can apply what they have learned using R, an open-source, free statistical analysis software to complete lab exercises. To help students learn R, they have the option to use DataCamp, which is integrated into the Coursera course. Students can complete a project in which they analyze data of their own choosing. There are many student comments like the one below:
This is definitely the best Coursera course I have ever taken part in. DataCamp is a phenomenal tool.
Also, in my 20+ years of programming, I’m yet to see a learning tool as good as Datacamp.
Because the DataCamp integration is new, and students must enter DataCamp from a link within Coursera, there has been some confusion and anxiety about grades on these lab exercises. DataCamp engineers have been responsive to student questions on the course forums, making modifications as needed.
Student reaction
Student reaction has been tremendous!
I’m just chiming in here because it’s frankly astonishing and heart-warming to see how pedagogically gifted Dr. Çetinkaya-Rundel is. I’m joining the Signature Track as a gesture of respect for the unprecedented amount of preparation which she has poured into this course.
The most active discussion forum is the one where students introduce themselves, with 608 posts to date. Students describe a wide range of motivation and relevant backgrounds.
The next most active forums debate whether the course is too time consuming and too difficult, while other students praise the course, pointing out how well the instructor simplifies the concepts, the good explanations in the text, and state that learning to do data analysis does take practice. Students trade tips for how to study, discuss how much time the course takes, recommend other courses and identify useful resources for each other.
…I just wanted to see if people agree with me about this. This course is unbelievably time consuming. I’ve worked longer on this course than all of my other Coursera courses combined – heck, I would longer on this course than I did for most courses in my undergrad college career.
I agree with you that the course is time consuming but it’s also very interesting and practical, which make me stick to. Usually I spent 2-3 hours on reading the textbook (I found it’s much more easier to follow the videos if you preview the lessons) , 4-5hours on the videos (I usually took one-week videos in a weekend day) , 1.5-2 hours on the quizz and lab (the instruction is clear and easy to be understood, even though I have no R backgound), so there are about 8-10 hours per week for this course. That’s ok for me for now.
I (very respectfully) mostly disagree with you. Yes, 6-8 hours is definitely too low, but 15-20 is a lot. I have a full time job and two kids, so I can spend on this course 1-2 hours on the night (and not always) plus 3-4 either in total or split during the weekend. So far, I’ve been able to do all videos, all the quizzes, do the project proposal and also all the exercises of the book. I don’t find it overwhelming: DEMANDING, definitely, yes, but I wasn’t expecting to learn statistics and probability by watching a couple of videos.